Go to Optimise > Cluster 2 Analysis (N clusters)
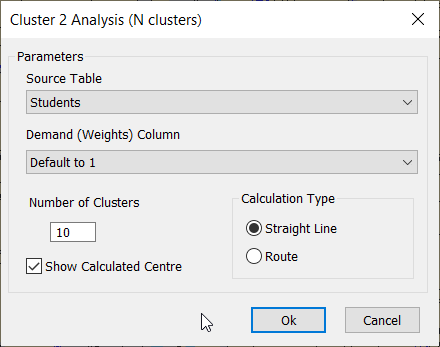
This function solves the problem of clustering customers into N clusters, so total distance between cluster center and customers is minimized. An optional demand can be also be taken into account. It is aimed at sorting different objects into meaningful groups.
Parameters
You first need to pick the point table you want to use.
You can select a column that represents the demand for each point. For instance a point might represent a different number of survey points.
If a specific column is not selected then each point will have a default demand of 1.
Next you have to input the number of centres (i.e number of groups) you would like the function to produce. You can also select the option to show the centre point of each group just tick the box.
Calculation type
The cluster algorithm uses a matrix in order to work. This can be a straight line or a calculated route distance. The straight line is very quick but is not as accurate as a routed distance, There is an example below.
Click OK to perform the calculation.
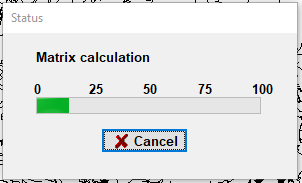
If you have selected the route matrix type then you might see the following progressbar.
If your table does not have a column to store the result then you will see this prompt:
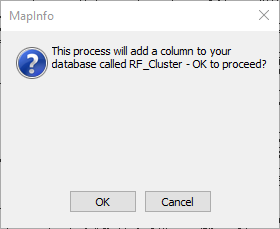
If you click "Yes" then the column is added as in integer column. The result of the clustering is stored in this column in the original table.
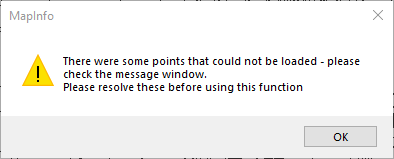
You will get a message if that tables you select have deleted rows or have records that are not geocoded.
Otherwise the calculated groups will be displayed.
")
Cluster analysis using straight line (A)
")
Cluster analysis using routes (B)
You can see that using straight line can produce compact groups, but they do not take into account natural barriers such as rivers. On the (B) picture blue and screen dots are better separated by the water.